Debugging python tests#
Measmatic offers the possibility to debug self-created Python scripts to make the developer's work easier. The procedure for setting up and activating debugging is explained below.
Requirements#
The debugging functionality is available in Measmatic 2.3.0b17 and newer. The following software must be installed in order to use the debugging functions.
- latest Visual Studio Code
- latest Python extension for Visual Studio Code
Activating developer mode#
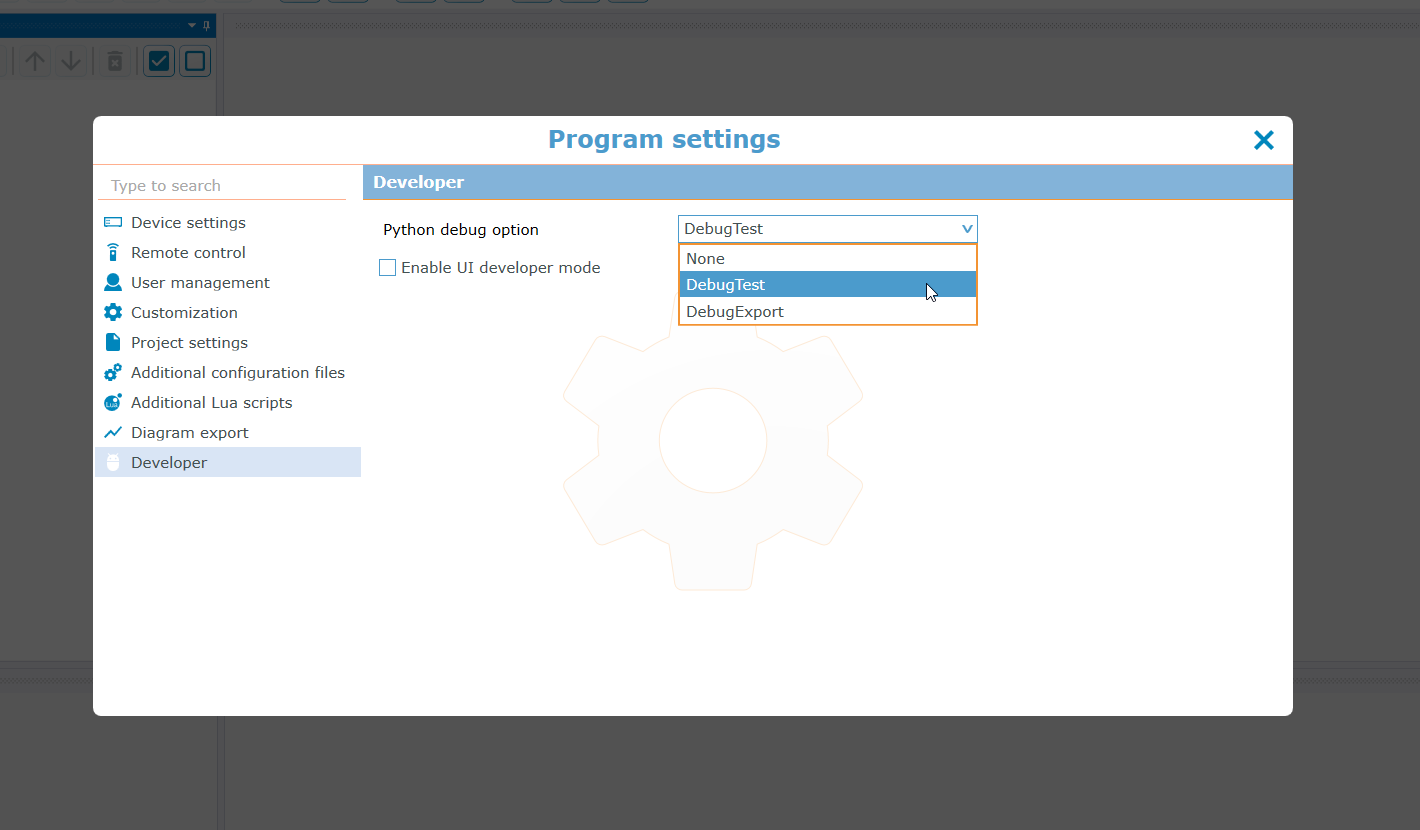
In order to debug Python scripts you have to choose a Python debug option in Measmatic. For that you need to open the program settings (Settings → Program settings) and navigate to the developer section. You have the option to debug a test (DebugTest) or debug an export filter (DebugExport).
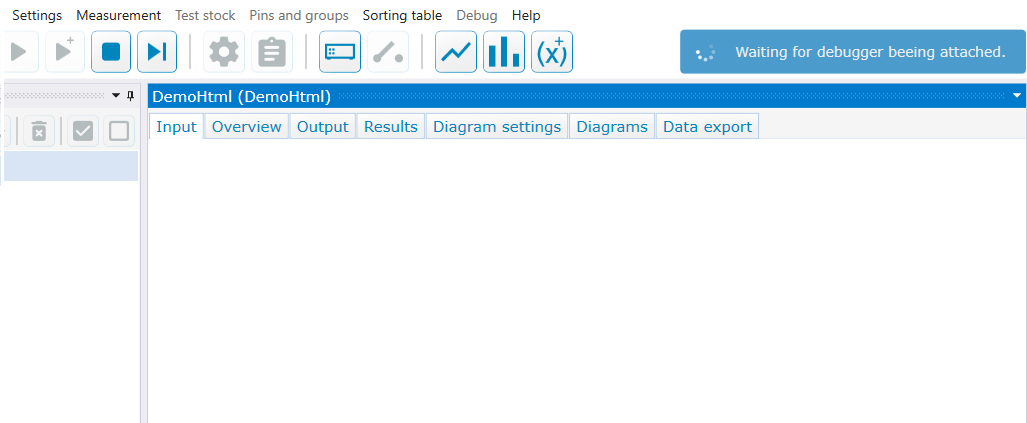
As soon as an option is activated and a test or export filter is executed, Measmatic tries to start the developer environment and is waiting 30 seconds for a debugger to be attached.
Note
It's not allowed to have spaces in the Python script name (test or export filter) you want to debug. To remove spaces from the filename simply open the test inside the Measmatic test editor and press the save button. This automatically replaces spaces with underscores.
Using Visual Studio Code (VS Code)#
Measmatic sets all necessary settings when opening VS Code to start debugging directly. This includes opening the corresponding Python file for the test or export filter and configuring the debugger in VS Code.
Hint
If Visual Studio Code is started the first time (or updated) the release notes appear hiding the opened python file. In this case simply close the release notes.
If the folder containing the scripts was not opened before VS Code is asking if you trust the authors. A In this case simply check the Trust the authors of all files checkbox and press the Yes, I trust the authors button.
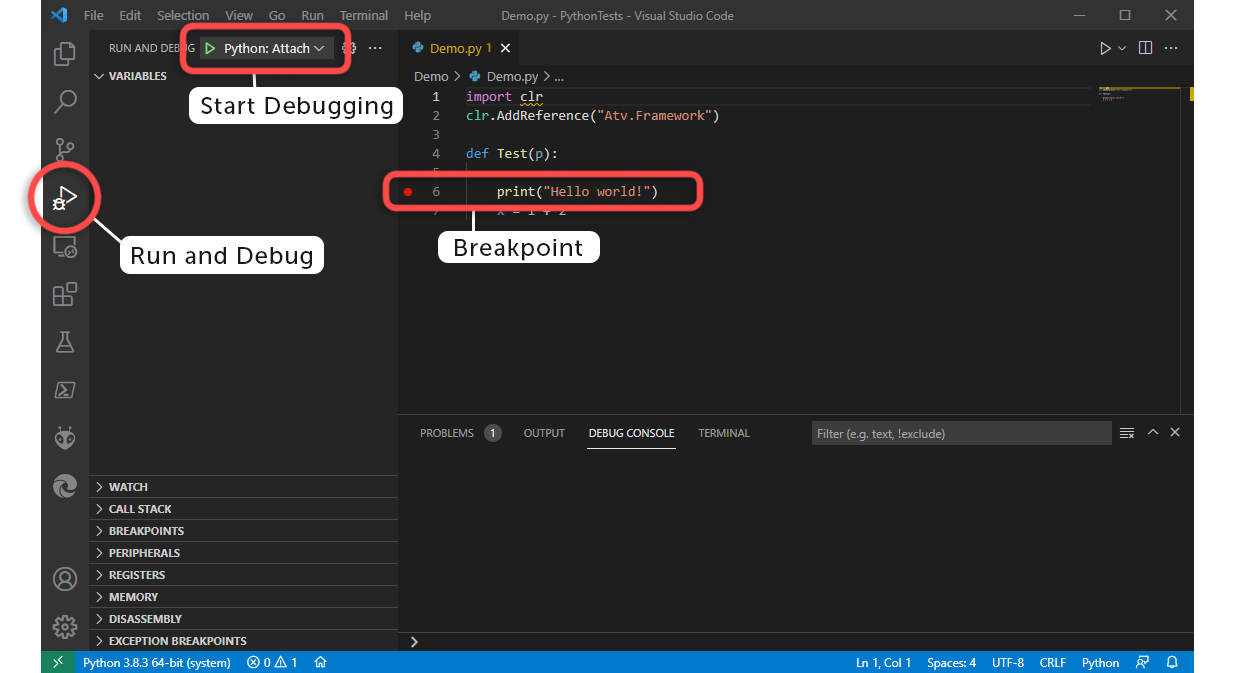
To attach the debugger to Measmatic, first go to the Run and Debug section in VS Code. Then press the Start Debugging button.
Hint
Set a breakpoint before attaching the debugger.
This triggers the debugger to attach to Measmatic. As soon as the debugger is attached the test script or export filter is executed. Set breakpoints are now hit.
Troubleshooting#
It is possible that you experience performance issues after running a test multiple times when in debug mode and using VS Code. This may be caused by an update of the threads in the callstack view in the run and debug section of VS code.
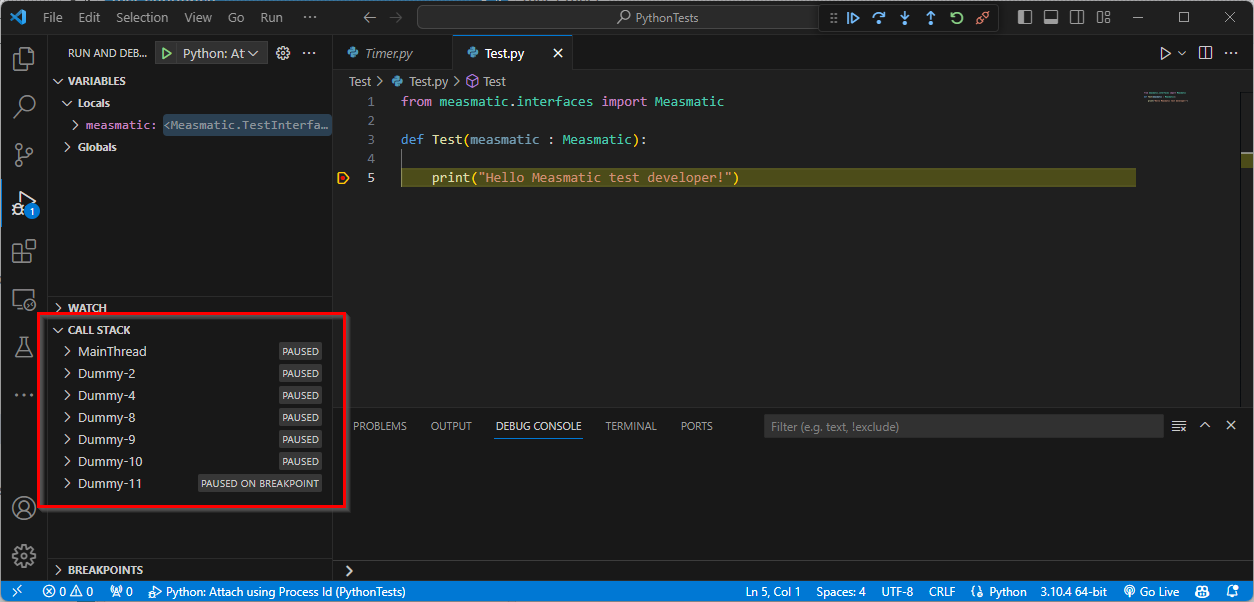
To prevent this problem, the callstack view must be collapsed.
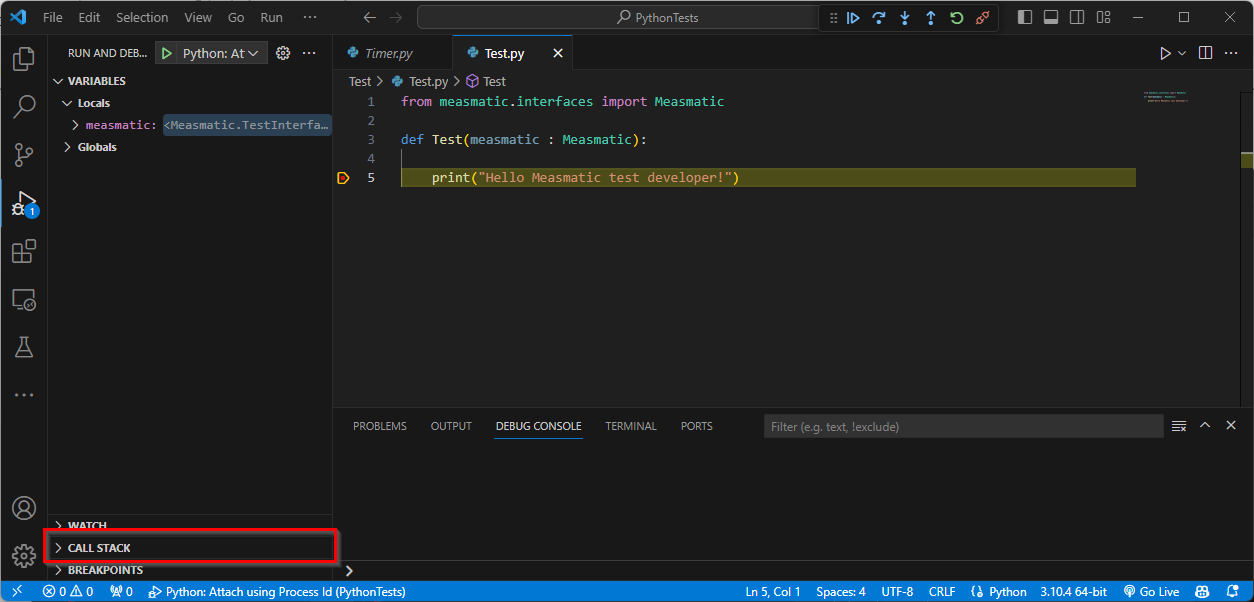
For more information about debugging in VS Code see https://code.visualstudio.com/docs/editor/debugging.